With the recent introduction of the Quantum Twisting Microscope, the requirements for cantilevers have become increasingly strict. Quantum Twisting Microscopy requires exceptionally sensitive force detection under cryogenic conditions.
The c-sense Quantum Cryogenic Trilayer (QCT) Cantilevers combine a novel SiN/polymer trilayer architecture with integrated piezoresistive sensing to deliver up to 4× higher force sensitivity than conventional silicon cantilevers. Designed specifically for low-temperature AFM, they provide a robust platform for studying quantum materials, moiré structures, tunneling phenomena and spin dynamics without optical beam deflection.
In practice
How researchers use it
Example 1: Quantum twisting microscopy at 4 K
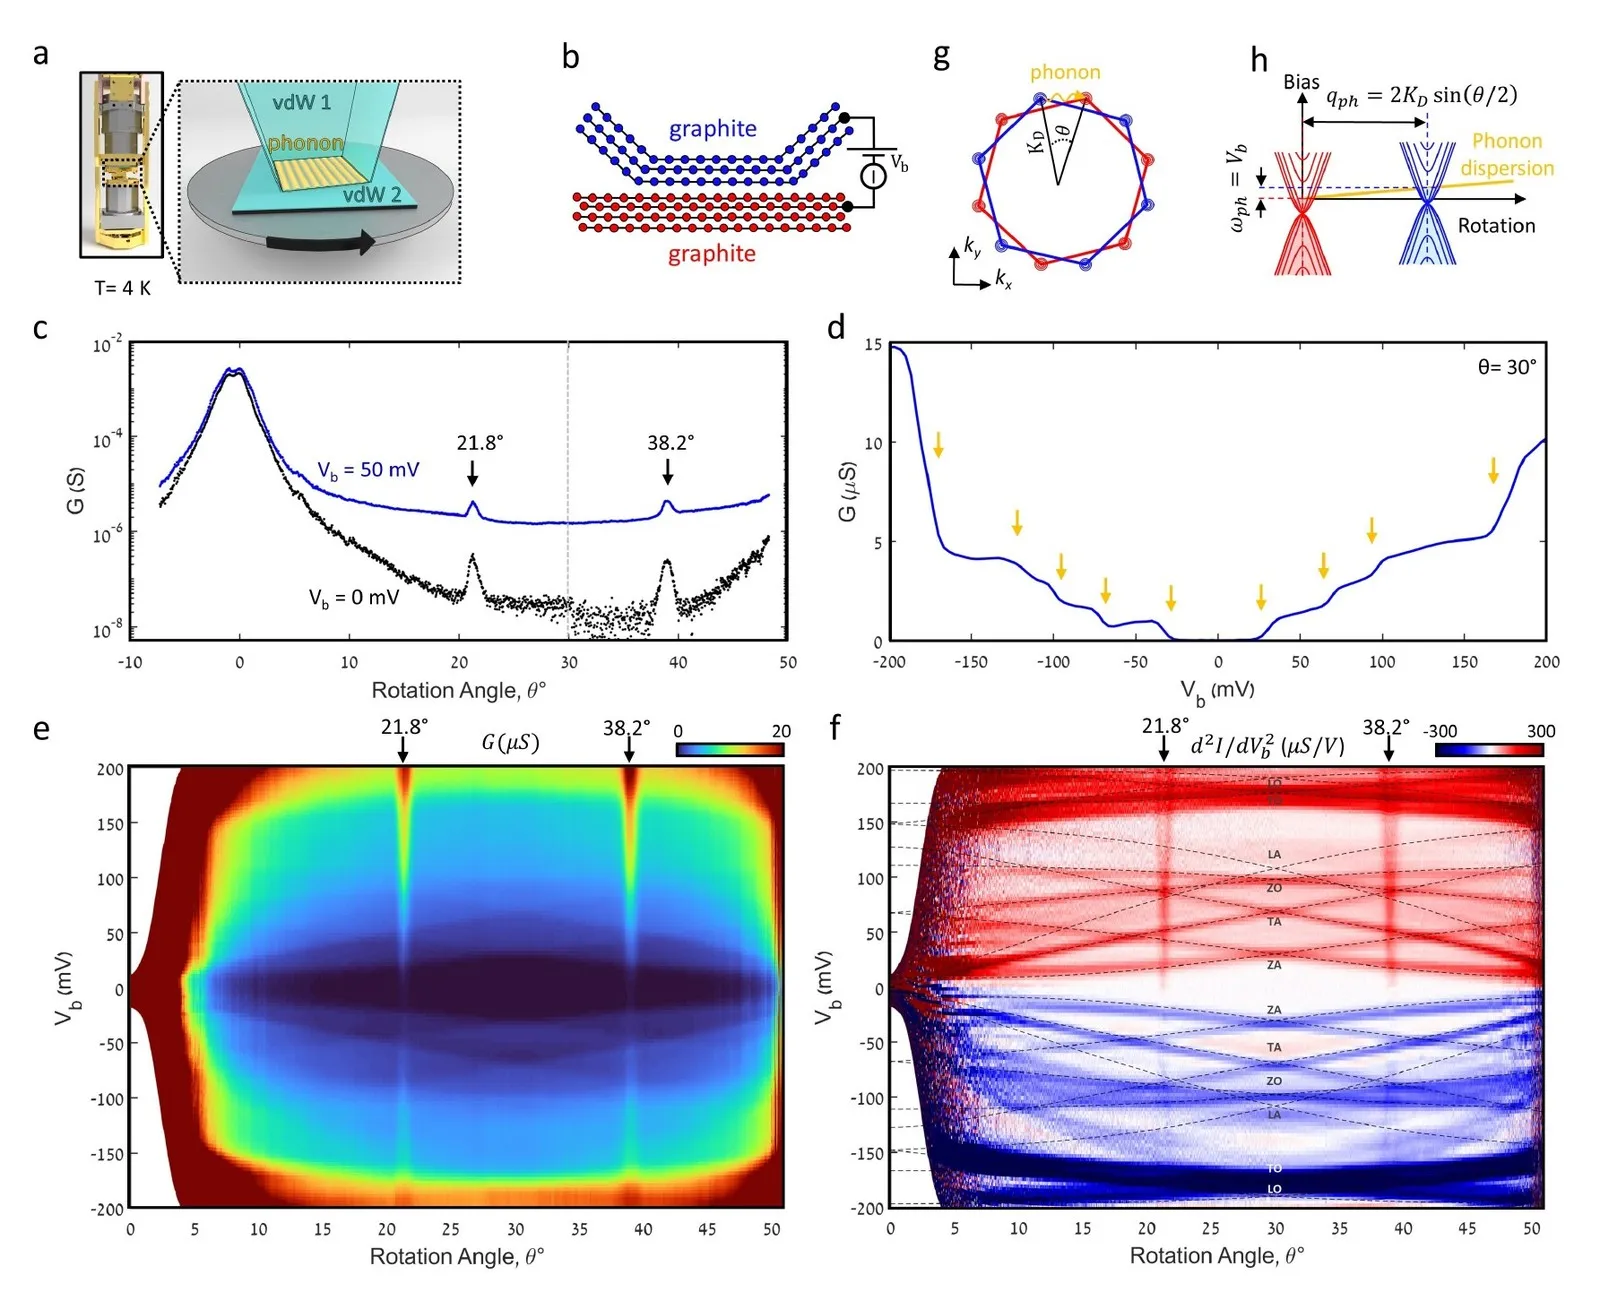
Principle of the cryogenic quantum twisting microscope. (a) A van der Waals stack on the tip rotates against a second stack at 4 K. (b) The twisted junction between two graphite flakes. (g, h) At a finite twist angle an electron tunnels by emitting a phonon that supplies the missing momentum. Credit: Birkbeck et al., Fig. 1 of the preprint arXiv:2407.13404; published open access in Nature (2025)
The study. The Weizmann Institute of Science built a cryogenic quantum twisting microscope. A van der Waals stack on the tip is pressed onto a second stack and rotated, which forms a continuously twistable interface at 4 K. With it the team mapped the phonon dispersion and the electron-phonon coupling in twisted bilayer graphene.
Where our cantilever is used. The tip-side stack is built on a tipless self-sensing AFM cantilever with piezoresistive elements. Its signal is used to monitor the contact force and hold it constant while the interface is twisted and scanned, so the contact area stays the same throughout the measurement.
Full figure: schematics (a, b, g, h) and the measured conductance as a function of twist angle and bias voltage (c to f), from which the phonon dispersion is read. Credit: Birkbeck et al., Fig. 1 of the preprint arXiv:2407.13404; published open access in Nature (2025)
J. Birkbeck, J. Xiao, A. Inbar et al., Nature (2025), doi:10.1038/s41586-025-08881-8; preprint arXiv:2407.13404.
Example 2: First observation of phonon angular momentum
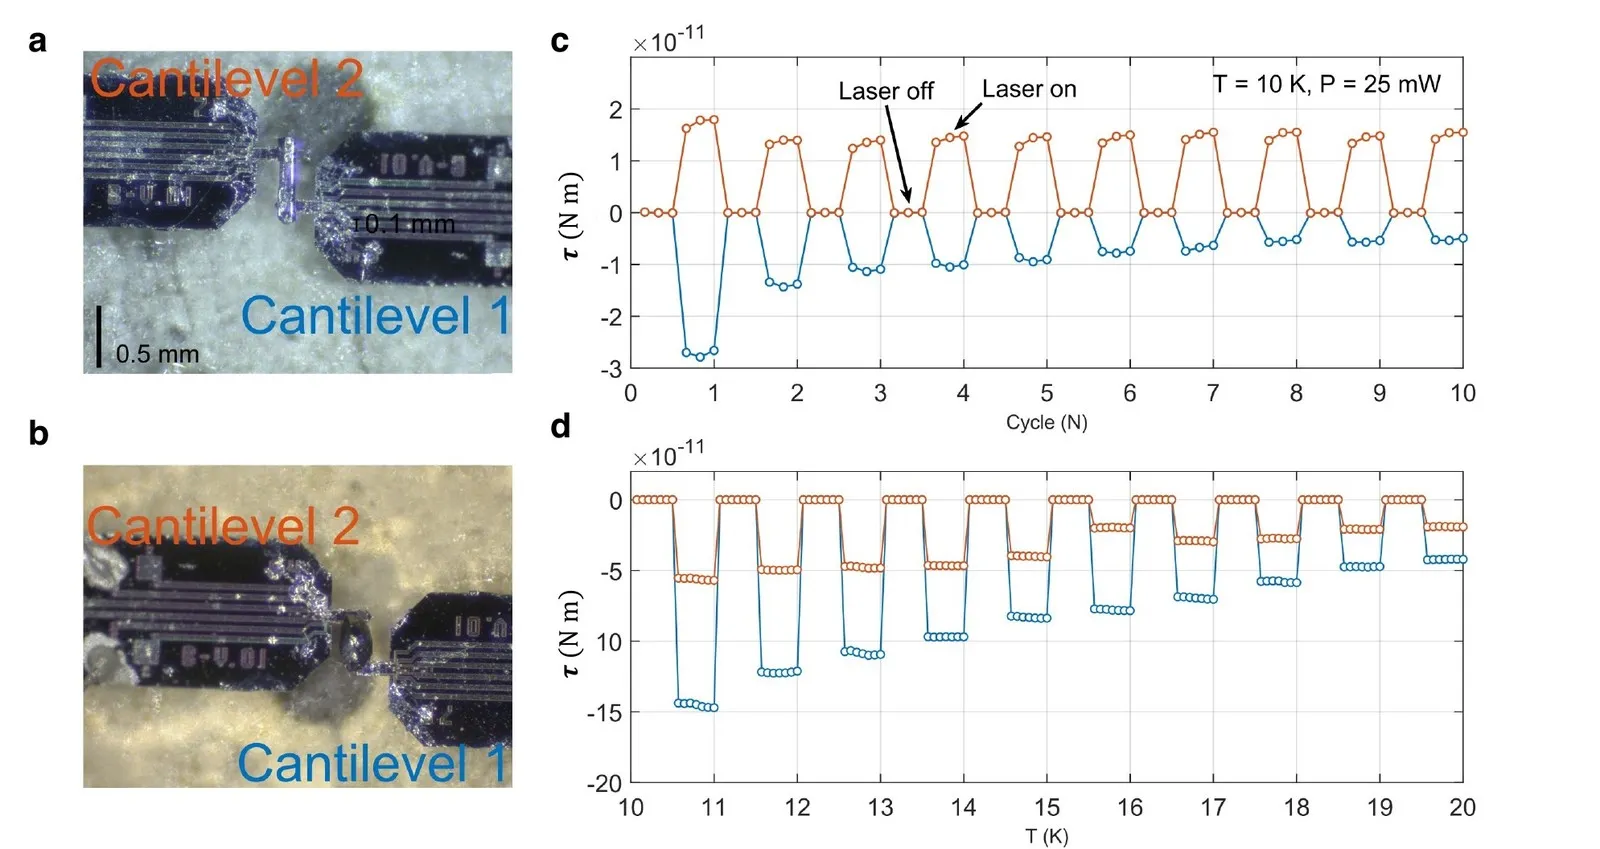
(a, b) Tellurium samples mounted between two cantilevers: single crystal and polycrystalline. (c) Torque response of the single crystal when the heating laser is switched on and off. (d) Temperature dependence of the torque for the polycrystalline sample. Credit: Zhang et al., Fig. 2 of the preprint arXiv:2409.13462; Nature Physics (2025); use with the authors' permission
The study. Theory predicted that lattice vibrations (phonons) can carry angular momentum. At Oak Ridge National Laboratory this was observed for the first time: a thermal gradient along the chiral axis of a tellurium crystal produces a mechanical torque of about 10⁻¹¹ N·m. The torque changes sign when the gradient is reversed and disappears in polycrystalline samples.
Where our cantilever is used. The crystal is mounted between two tipless PRSA 300 µm × 100 µm cantilevers, which act as the torque sensors. The torque bends the cantilevers, and their built-in Wheatstone bridge turns the bending into the measured signal.
H. Zhang et al., Nature Physics (2025), doi:10.1038/s41567-025-02952-3; preprint arXiv:2409.13462. Figure: use with the authors' permission.
Example 3: Magnetisation and spin resonance on one cantilever
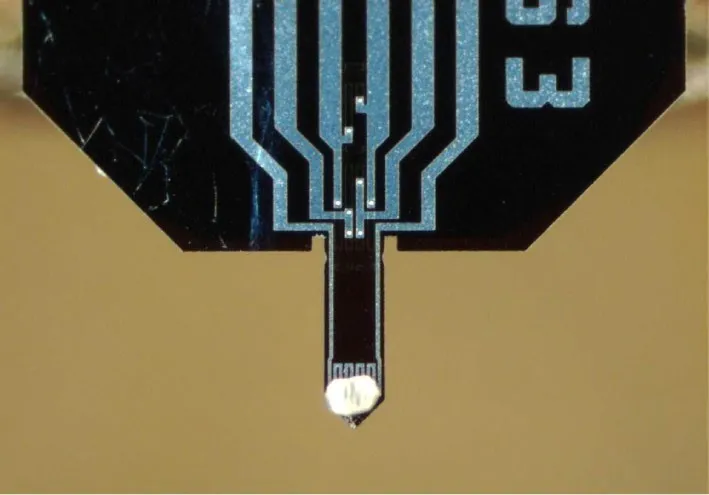
A microcrystal glued to the end of a self-sensing cantilever for combined magnetometry and electron spin resonance. Credit: Alfonsov et al., Appl. Magn. Reson. 53, 555–563 (2022), CC BY 4.0
The study. Many new magnetic materials exist only as tiny crystals, too small for standard magnetometers and spin-resonance spectrometers. Leibniz IFW Dresden developed a setup that measures the static magnetisation and the electron spin resonance of such a crystal at the same time, in a single run at 7 K.
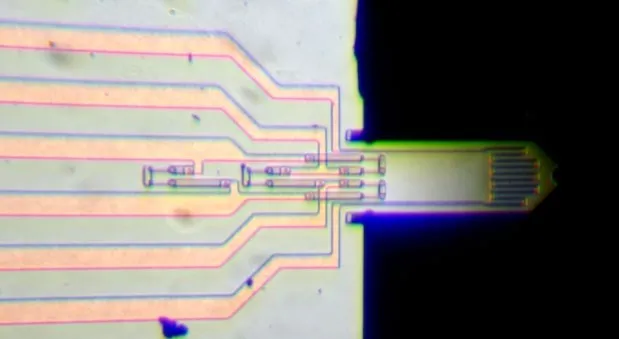
Where our cantilever is used. The crystal is glued to the end of an SCL-Sensor.Tech cantilever with four integrated piezoresistors. The cantilever is sample holder and detector in one: its static bending gives the magnetic torque, and the shift of its resonance frequency and its vibration amplitude detect the spin resonance.
Microscope image of the piezoresistive cantilever used for the measurement. Credit: Alfonsov et al., Appl. Magn. Reson. 53, 555–563 (2022), CC BY 4.0
A. Alfonsov et al., Applied Magnetic Resonance 53, 555–563 (2022), doi:10.1007/s00723-021-01339-w. CC BY 4.0.